
Lighthouse Reports Explained: How to Read Results and Compare Audits
Understand what your Lighthouse report tells you and which issues to fix first. Learn how to compare audits and investigate performance changes after a release.
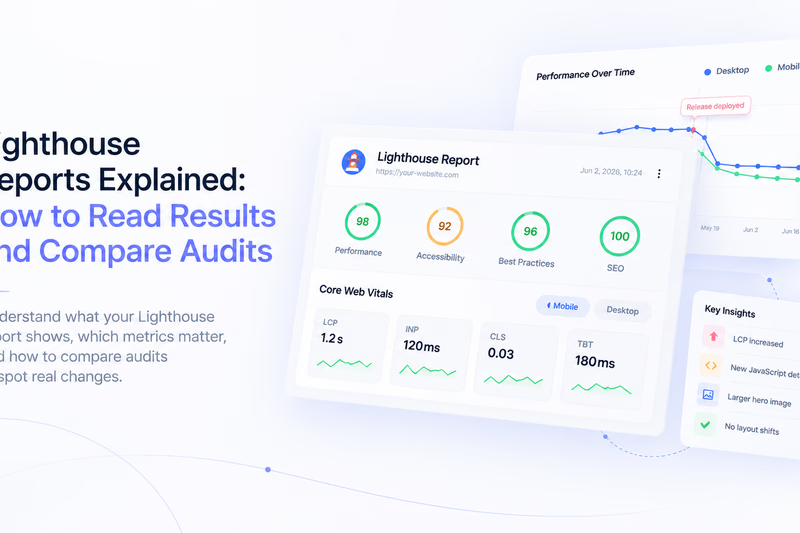
A Lighthouse report can tell you that a page is slow, show which parts of the loading process need attention, and help you check whether a fix worked. The difficulty is deciding what the results mean. A lower score after a deployment might point to a performance regression, but it can also reflect different test conditions or a change in the content served during the audit.
Reading the report properly starts with looking beyond the score. You need to understand the individual metrics, connect them to the resources and behaviour of the page, and compare results collected under consistent conditions. This guide explains how to do that, from reviewing a single audit to tracking changes across a website.
What does a Lighthouse report show?
Lighthouse audits a page and produces results for the categories you select. In a typical PageSpeed Insights test, these include Performance, Accessibility, Best Practices, and SEO. Each category examines a different part of the page, so its score needs to be interpreted separately. You can generate reports through Chrome DevTools, PageSpeed Insights, or automated tooling.
The Performance section describes how the page loaded during the test. Accessibility checks identify issues that automated testing can detect. Best Practices examines selected technical concerns, while SEO checks cover basic requirements that help search engines access and understand a page.
These results have limits. A high Accessibility score still needs to be supported by manual testing, and a high SEO score does not establish that a page deserves to rank for its target keywords. Treat each category as a set of checks with a defined scope.
Before investigating a Google Lighthouse report, confirm that it tested the page you intended. Look at the final URL and screenshot. A redirect, consent screen, blocked request, or error page can produce a valid report for the wrong experience.
How to interpret the Performance score
The Performance score is a weighted combination of metric scores. Scores from 90 to 100 are classified as good, 50 to 89 as needing improvement, and below 50 as poor. Individual recommendations do not directly add or subtract points. They affect the score when the changes you make improve the measured performance.
A score is useful for spotting changes, but it cannot explain them on its own. Two pages with similar scores may have different problems. One might display its main content late, while another displays content quickly but spends too much time executing JavaScript.
Start with the score, then inspect the metric values underneath it. If a page gets worse after a release, identify which measurement moved before deciding what to fix. Keep the raw values in your reporting so you can describe the change in seconds or milliseconds, rather than only in points.
The Lighthouse performance metrics that matter
The main Lighthouse performance metrics describe different aspects of loading. Reading them together helps you understand when content appears, how much work the browser performs, and whether the layout remains stable.
Largest Contentful Paint: when the main content appears
Largest Contentful Paint, or LCP, measures when the largest eligible content element in the viewport appears. On a product page, that element might be the product image. On an article, it could be a large heading or another prominent content block.
When LCP is slow, identify the element and examine where the delay occurs. An image can arrive late because the server responds slowly, the browser discovers the image late, the download takes too long, or rendering is delayed after the download finishes. Compressing the image only addresses part of that process.
For example, if a hero image is discovered only after JavaScript runs, reducing its file size may leave much of the delay in place. The more useful fix may involve making the resource discoverable earlier. Follow the evidence in the report before choosing an optimisation.
Total Blocking Time: work that keeps the browser busy
Total Blocking Time, or TBT, helps identify loading periods when the main thread is occupied by long tasks. For a task lasting more than 50 milliseconds, the portion beyond that threshold contributes to blocking time. A 120-millisecond task therefore contributes 70 milliseconds.
If TBT increases after adding a widget, analytics integration, or application feature, inspect the work introduced by that change. The relevant question is which scripts execute, when they execute, and how much work they create. Download size alone will not answer it.
TBT can help diagnose responsiveness risks, but it does not measure the same thing as Interaction to Next Paint. A normal page-load audit does not reproduce the full range of interactions visitors perform. A page can behave reasonably during loading and still respond poorly when someone opens a menu, filters products, or interacts with a complex component.
Cumulative Layout Shift: movement that disrupts the page
Cumulative Layout Shift, or CLS, measures visual instability. Images without reserved dimensions, expanding embeds, and dynamically inserted content are common places to investigate. Unlike loading metrics expressed in seconds or milliseconds, CLS is a unitless score.
If the report identifies a shifting element, inspect what changed around it as well. The element that moves may be reacting to another element being inserted above it. Fixing the displaced element will not necessarily address the source of the movement.
A navigation audit only captures the experience recorded during that run. Layout shifts that happen later, such as after scrolling or interacting with a component, may require additional investigation. A stable loading sequence is useful evidence, but it does not establish that the page remains stable throughout a visit.
First Contentful Paint: the first visible response
First Contentful Paint, or FCP, measures when the first text or image content appears. It helps you understand how long a visitor waits before the page begins to show something useful.
A slow FCP is a reason to investigate the work that happens before initial rendering, including the document response and resources that block rendering. A fast FCP needs context too. A page might display its header quickly while leaving the main content area empty for several seconds.
Compare FCP with LCP and the loading screenshots. The gap between the first visible content and the main content can reveal a loading experience that feels much slower than FCP suggests.
Speed Index: how the visible page fills in
Speed Index describes how quickly content becomes visible during loading. Lighthouse calculates it from the visual progression captured during the test, so it provides a broader view of how the page fills in.
Use the loading screenshots alongside this value. Look for long periods where the page appears incomplete, large sections arrive late, or important content remains hidden behind a loading state. The screenshots give the timing numbers context and help you decide which part of the loading sequence needs attention.
Lighthouse results and Core Web Vitals are different views
PageSpeed Insights combines a Lighthouse lab test with field data from the Chrome User Experience Report when sufficient data is available. The lab test describes a particular run. The field section reflects real visitor experiences over a trailing 28-day period. Check whether those field results apply to the specific URL or to the wider origin.
Core Web Vitals include LCP, Interaction to Next Paint, and CLS. Their good thresholds are 2.5 seconds or less for LCP, 200 milliseconds or less for INP, and 0.1 or less for CLS, assessed at the 75th percentile of field experiences. A green Lighthouse Performance score does not guarantee a passing field assessment.
This distinction matters when validating a release. A fresh lab test can show the effect of a change immediately, while the field reporting window still includes visits from before the deployment. Use lab tests to investigate changes promptly and field data to assess how visitors experience the site over time.
How to turn report findings into a useful fix
A Lighthouse performance report can contain more findings than a team can address in one development cycle. Prioritise by connecting a finding to an observed problem on a page that matters to the business.
Suppse a product page has slow LCP and the report points to delayed loading of the main product image. That gives you a specific investigation: determine when the browser discovers the image, when the request starts, and what delays its appearance. The resulting task should describe the affected resource and the expected improvement, rather than simply asking someone to “improve Lighthouse.”
Keep the report version in mind when following tutorials or comparing saved results. Lighthouse 13 removed several older audits after replacing them with newer performance insights. A finding disappearing between versions does not necessarily mean the underlying issue was fixed.
For each proposed fix, record the affected URLs, the metric you expect to improve, and the test conditions you will use to verify it. This makes the follow-up audit much easier to interpret. It also helps prevent a common problem: completing a technical change without checking whether it improved the experience that prompted the work.
How to compare Lighthouse audits fairly
A useful comparison starts before you run the second audit. Save enough information about the baseline to reproduce the test, including the URL, device profile, Lighthouse version, test environment, and relevant page state.
Keep the testing conditions consistent
Compare mobile results with mobile results and desktop results with desktop results. Use the same testing method and keep network and CPU settings consistent where you control them. If you run audits locally, background activity and browser extensions can affect the measurements. Results collected on different machines may also reflect differences in the testing environment.
Page state deserves the same attention. A page with a consent banner, a different experiment variant, or a different set of third-party resources may perform different work. Check screenshots and loaded resources when a result looks unusual.
Record tool upgrades as well. If the Lighthouse or browser version changes between the baseline and the follow-up, establish whether the apparent difference comes from the page or from the measurement process. Where possible, rerun the baseline and updated page using the same tool version.
Repeat runs and examine the spread
As a practical starting point, run three to five audits for each version under the same conditions. Compare the median of each metric and keep the individual results. This gives you a better basis for investigation than choosing the fastest run before a release and the slowest run afterwards.
The spread matters too. If your baseline LCP ranges from 2.1 to 3.6 seconds, a new result of 2.8 seconds does not establish a regression. If repeated baseline runs cluster near 2.1 seconds and repeated follow-up runs cluster near 3.0 seconds, the change deserves closer attention. More variable pages may need additional runs and tighter control of test conditions.
Avoid treating a fixed score drop as universal proof of a problem. A change that is unusual for one page may fall within the normal range for another. Your own audit history helps establish what is worth investigating.
Compare individual metrics before assigning a cause
Consider an illustrative comparison of five mobile audits before and after a release. Median FCP increases slightly, from 1.3 to 1.4 seconds. Median LCP rises from 2.2 to 3.1 seconds, while median TBT increases from 180 to 410 milliseconds. CLS stays at 0.03.
These example values suggest that the investigation should focus on main-content loading and main-thread work. Visual stability appears unchanged in the recorded tests, and the small FCP movement is less pronounced than the changes in LCP and TBT.
The values do not identify the cause. A new script might explain the extra blocking time, while an unrelated image change might explain LCP. Inspect the relevant resources, tasks, and deployment changes before attributing both movements to one feature.
After implementing a fix, repeat the same comparison. Keep the original baseline so you can see whether the page recovered fully or only improved relative to the slower release.
What useful Lighthouse reporting should include
Lighthouse reporting becomes more valuable when the summary explains what changed and what happens next. A stakeholder should be able to understand the affected pages, the size of the change, and whether the finding has been reproduced.
For example, a useful update might read: “Across five mobile runs, median LCP increased from 2.2 to 3.1 seconds after the release. The change appeared on the three product URLs tested. We are investigating delayed loading of the product image and will repeat the same audits after the fix.”
That statement separates observation from investigation. It also gives the next person enough context to continue the work. Keep the underlying reports and test settings available so developers can inspect the evidence rather than relying on a screenshot of the score.
A report should also make uncertainty visible. If the runs vary widely or the test conditions changed, explain that before presenting the result as a confirmed regression. This prevents the team from spending time fixing a problem that has not yet been reproduced.
Applying the same process across a website
A homepage audit tells you little about a product template, an article page, or a category page with dozens of images. For a larger site, choose URLs that represent important templates and business journeys. Include pages affected by the release you are reviewing.
Keep comparisons at URL level, then look for patterns across templates. If several product pages show a similar LCP increase while articles remain stable, start by examining the product template and its shared resources. A site-wide average can hide that pattern, especially when improvements on some pages offset deterioration on others.
PSI Lynx supports this workflow through bulk Lighthouse and PageSpeed checks, metric history, and performance regression monitoring. Repeated checks let you review changes across a set of pages and return to earlier measurements when something gets slower. The same discipline still applies: compare equivalent tests, inspect the metrics that changed, and investigate the affected pages.
Start with a manageable group of important URLs and establish a baseline. Once those results are consistent enough to interpret, expand coverage. A useful audit history should help your team locate problems and verify fixes, with enough context to explain why the numbers changed.