
Nike Website Performance Report 2026: PageSpeed Insights Analysis
Want to run the same analysis on your own ecommerce site? PSI Lynx continuously monitors Core Web Vitals, Lighthouse metrics, and performance regressions across hundreds or thousands of URLs, so you can catch issues before they affect users or organic traffic.
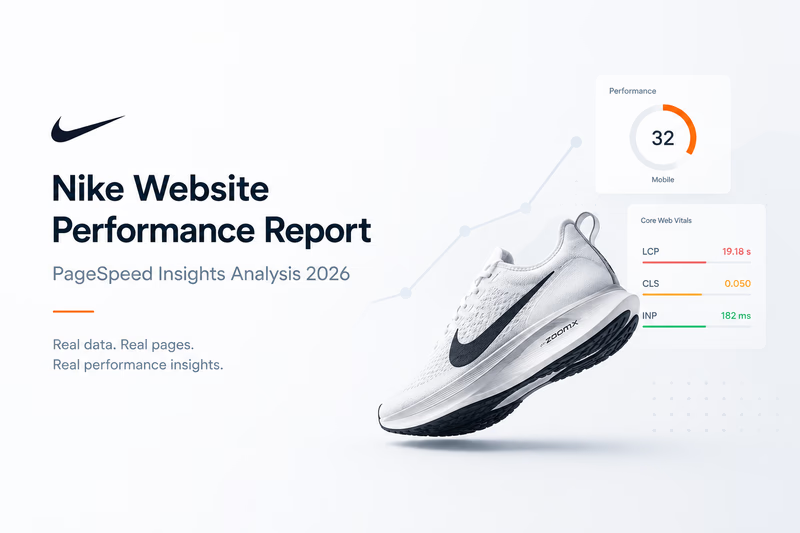
Nike scored 60 out of 100 on our health check, with mobile performance at 32 and mobile LCP at a startling 19.18 seconds. We ran a PageSpeed Insights and Core Web Vitals analysis across five key page types, and the pattern was consistent: even one of the world’s most sophisticated ecommerce sites struggles badly with performance, especially on mobile.
Nike operates one of the largest ecommerce websites in the world. Millions of people visit every day to browse products, search for shoes, and place orders. At that scale, even small performance issues affect a huge number of users.
For this research we didn’t limit ourselves to a single PageSpeed Insights test on the homepage. We ran a broader website performance test across several key page types: the homepage, search results, category pages, catalog pages, and a product page. The goal was to see how the experience changes as users move through the site, using Google Lighthouse metrics alongside Core Web Vitals.
Executive summary
The numbers make it clear that Nike’s biggest challenge isn’t SEO or accessibility. It’s performance.
Overall results
- Health Score: 60 / 100
- URLs analyzed: 5
- Critical pages: 5
- Pages without data: 1
Average Lighthouse scores
- Mobile Performance: 32
- Desktop Performance: 44
- Accessibility: 82 (mobile) / 75 (desktop)
- Best Practices: 96
- SEO: 87 (mobile) / 94 (desktop)
Core Web Vitals
- Mobile LCP: 19.18 s
- Desktop LCP: 2.94 s
- CLS: 0.050 (mobile) / 0.070 (desktop)
Best Practices scored exceptionally well, but every tested page struggled on performance. Mobile was hit hardest, with none of the analyzed pages reaching a good Lighthouse Performance score.
The homepage isn’t the slowest page
One of the most common mistakes during an SEO audit is assuming the homepage represents the entire website. It rarely does. In Nike’s case, the weakest page wasn’t the homepage, it was the search page, which scored just 23 on mobile. The homepage followed at 28, while product pages did slightly better at 41. None of those are close to what most teams would call acceptable.
This is exactly why a single page speed test on the homepage doesn’t tell the full story. Large ecommerce sites use different templates, components, and JavaScript bundles depending on the page type, and the performance profile changes with each one.
Core Web Vitals paint a more interesting picture
Synthetic scores tell one story; Core Web Vitals tell another. Layout stability isn’t a major concern here. Around 60% of both mobile and desktop pages pass Google’s CLS threshold, so users aren’t dealing with significant layout shifts.
Largest Contentful Paint is where things fall apart. Not a single analyzed mobile page passed Google’s LCP threshold, and desktop managed only a 60% pass rate. Visitors aren’t waiting because elements keep moving around the page. They’re waiting because the most important content simply appears too late, and for an ecommerce site that is a much bigger problem.
JavaScript is holding everything back
After reviewing the diagnostics, one issue kept showing up across almost every page: too much JavaScript. The report repeatedly highlights the same opportunities:
- Reduce unused JavaScript
- Remove unused CSS
- Reduce JavaScript execution time
- Eliminate duplicated JavaScript
- Minimize main-thread work
- Reduce large network payloads
These appear across nearly every analyzed URL, which makes it clear this isn’t a page-specific issue. It’s part of the frontend architecture itself. We see this often on large ecommerce platforms: new features, marketing tools, personalization engines, analytics scripts, A/B testing platforms, and third-party integrations slowly grow bundle size over time. No single release causes a disaster, but after months of continuous growth the site becomes noticeably slower.
Heavy payloads keep hurting performance
JavaScript is only part of the picture. The diagnostics also uncovered several recurring issues affecting nearly every analyzed page:
- render-blocking resources
- oversized network payloads
- inefficient cache lifetimes
- legacy JavaScript
- forced reflows
- delayed image delivery
- slow LCP resource discovery
- long JavaScript execution time
Individually, none of these is unusual. Together they create a chain reaction that increases Total Blocking Time, delays rendering, and makes the site feel much slower than users expect.
Why this matters for SEO
A traditional SEO audit usually focuses on metadata, indexing, crawlability, and internal links. Those areas matter, but they don’t explain why users abandon pages before they even become usable. Google has spent years making Core Web Vitals a core measure of real user experience. When pages consistently deliver poor Largest Contentful Paint or excessive blocking time, visitors leave earlier, interact less, and convert less often. Performance isn’t separate from SEO anymore; they’re tightly connected, and a technically optimized site that loads too slowly will always struggle to reach its full organic potential.
The biggest takeaways
These results are striking because they show that even one of the world’s most sophisticated ecommerce companies still faces significant performance challenges. The main findings from this website performance test are straightforward:
- Mobile performance is considerably weaker than desktop.
- Largest Contentful Paint remains the biggest Core Web Vitals issue.
- JavaScript optimization offers the largest improvement opportunity.
- Search pages perform worse than the homepage.
- Most issues come from frontend architecture rather than backend response times.
- Best Practices scores remain excellent despite poor loading performance.
One PageSpeed Insights report isn’t enough
If we had tested only Nike’s homepage with PageSpeed Insights, we would have reached the wrong conclusion. The homepage, search results, category pages, and product pages all have different performance characteristics. Each template introduces its own bottlenecks, which makes a single Google Lighthouse report an incomplete picture of the website.
That’s why continuous monitoring is far more valuable than an occasional page performance test. Tracking hundreds or thousands of URLs over time makes it possible to catch regressions early, spot recurring patterns, and prioritize the changes with the biggest impact on both user experience and SEO. For enterprise ecommerce websites, that’s where the real value of performance monitoring begins.