
Website Performance Regression Monitoring: What One-Time Lighthouse Audits Miss After a Release
One-time Lighthouse audits show how a page performs right now, but they don't tell you what changed after a release. Learn how performance regression monitoring helps teams detect when performance drops, which URLs are affected, and where to start investigating.
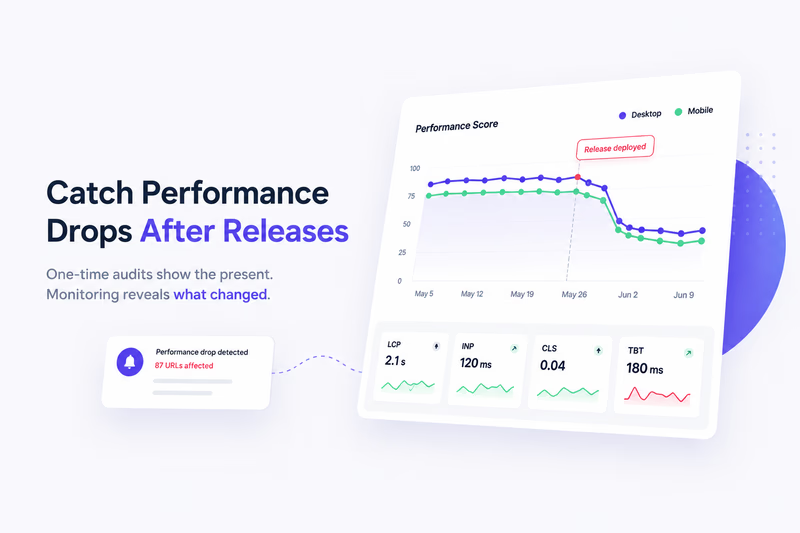
Running a Lighthouse audit before a release is useful. Running another one after the release is useful too. The problem starts when those isolated tests are treated as a monitoring strategy.
Websites change constantly. Developers ship new code, marketing teams add tracking scripts, product teams replace components, SEO teams modify templates, and third-party services update independently. A page that performed well last Monday can become noticeably slower on Tuesday without anyone intentionally touching performance.
That is where performance regression monitoring becomes different from a conventional performance audit. Instead of asking whether a page is fast or slow right now, it asks a more useful question: what changed?
For teams managing large websites, that distinction matters. A Lighthouse score of 74 might look bad, but the number alone gives you very little context. If the same page scored 76 for the previous six months, nothing significant may have happened. If it scored 94 yesterday, you probably have a regression worth investigating.
The problem is not simply poor website performance. It is unexpected deterioration that appears between releases, deployments, configuration changes, or third-party updates.
What Is a Website Performance Regression?
A performance regression is a measurable decline in website performance compared with an earlier baseline.
It can appear in many ways. Largest Contentful Paint may increase from 2.1 seconds to 3.4 seconds. Total Blocking Time may suddenly double. A previously stable layout may begin shifting during load. Lighthouse Performance scores may fall across an entire group of pages.
The important part is the comparison.
A traditional Lighthouse audit measures the current state of a URL. Performance regression monitoring measures the difference between that state and previous measurements.
Imagine a product page that had a Performance Score of 91 before a release, with LCP at 2.1 seconds, TBT at 180 milliseconds, and CLS at 0.04. After the release, the same page scores 74. LCP has increased to 3.4 seconds and TBT to 490 milliseconds, while CLS has barely moved to 0.05.
The CLS change is probably irrelevant. The changes in LCP, TBT, and overall Performance Score are not.
Now imagine that the same pattern appears across 87 of 120 monitored product URLs immediately after a deployment. At that point, you are no longer looking at an unusually slow page. You are looking at a site-level performance regression with a fairly clear starting point and scope.
That difference is what regression monitoring is designed to expose.
Why One-Time Lighthouse Audits Miss Regressions
Lighthouse is excellent at answering a specific question: how did this page perform during this test?
It is much less useful for answering another question: did something recently make this page worse?
That requires historical context.
Suppose you run a test today and receive a Performance Score of 78. Is that good or bad? You can compare it with common performance recommendations, but you still do not know whether anything changed. Maybe the page has scored around 78 for months. Maybe it scored 95 yesterday.
Those situations require completely different responses.
This is the limitation of using occasional manual audits as web performance monitoring. The audit itself is not the problem. The missing timeline is.
There is another practical problem. Teams rarely remember to manually test every important page after every release. Even if they do, testing a homepage and a few hand-picked URLs does not tell you what happened across a site containing hundreds or thousands of pages.
The larger the website becomes, the less representative a handful of manual tests becomes.
What Performance Regressions Look Like After a Release
Performance problems are often introduced by perfectly normal website changes.
A developer deploys a new image component. Marketing adds another analytics vendor through a tag manager. A consent management platform changes how scripts load. A new recommendation widget appears on product pages. A CMS update modifies the HTML generated by a template.
None of those changes needs to break the website.
The pages still load. Users can still buy products. Google can still crawl them. Monitoring systems checking only uptime remain green.
Performance has simply become worse.
A new JavaScript bundle can increase main-thread work and Total Blocking Time. A hero component can delay the Largest Contentful Paint. Poorly configured images can add several hundred kilobytes to every product page. A third-party script can introduce additional network requests and execution time.
These are exactly the kinds of performance regressions after releases that can remain unnoticed when teams rely on occasional testing.
And not every regression comes directly from your own deployment. Third-party services change too. Advertising platforms, analytics tools, chat widgets, experimentation software, CDN configurations, and external APIs can all affect performance without a commit appearing in your repository.
The useful question therefore becomes less about whether somebody deliberately changed performance and more about when measurable behavior changed.
One Slow URL Is Not the Same as a Template-Wide Regression
Large websites create another problem: scale.
Imagine an ecommerce site with 20,000 URLs. There might be a homepage, category pages, product pages, editorial content, search pages, campaign landing pages, and regional variations.
Testing one product URL tells you what happened to one product URL. It does not tell you whether the problem affects one page, one template, one section of the website, or everything.
This is why automated Lighthouse audits become more valuable as the number of URLs grows. Instead of repeatedly checking a few convenient pages, teams can maintain a representative set of URLs and run the same tests on a schedule.
For example, imagine that the homepage barely changes after a deployment and category pages lose only a couple of Performance Score points. Editorial pages remain stable. Product pages, however, drop by an average of 17 points.
The investigation has already become easier.
There is little reason to start digging through homepage code or editorial templates. The regression is concentrated in product pages, which points toward changes affecting that template or something loaded specifically within it.
The same logic works at a larger scale. If 87 out of 120 monitored product URLs deteriorate at roughly the same time, that pattern is much more informative than a red score on a single Lighthouse report.
Performance monitoring becomes significantly more useful when you can investigate groups of URLs rather than individual pages in isolation.
Lighthouse Monitoring Adds the Missing Timeline
A normal Lighthouse workflow is straightforward: run a test, inspect the result, fix the issue, and run the test again.
That workflow works well for optimization projects. It is less effective for detecting regressions because somebody still needs to decide when another test should happen.
Lighthouse monitoring changes the workflow by making measurement continuous or scheduled.
Instead of manually deciding when to check the website, you establish a baseline and keep collecting comparable measurements. When something changes, the historical data provides the context needed to understand whether the result is normal variation or a meaningful deterioration.
Imagine a group of product pages averaging a Performance Score around 90–92 throughout the week, with LCP consistently close to 2.1 seconds. A deployment goes live on Thursday afternoon. The next scheduled run shows an average Performance Score of 74 and LCP of 3.4 seconds. On Friday, another run produces almost the same degraded results.
You do not need sophisticated anomaly detection to notice what happened.
More importantly, the timeline gives the engineering team somewhere to start. Instead of receiving a vague report that “the website seems slower,” they can investigate what changed between the last healthy measurement on Thursday morning and the first degraded measurement after the release.
That is a much better debugging problem.
Core Web Vitals Monitoring Is Part of the Picture
Performance Score is useful for quickly identifying movement, but it should not be treated as the only signal.
Effective Core Web Vitals monitoring should track the metrics behind the experience as well. LCP can reveal deterioration in loading performance, CLS can expose new layout instability, and INP can indicate responsiveness problems visible in field data.
Lab metrics add additional diagnostic context. TBT can help identify increases in main-thread blocking. FCP can reveal changes in initial rendering. TTFB can point toward server-side or network-related deterioration.
The goal is not to watch every number and panic whenever something moves slightly. Performance tests naturally vary, especially between individual runs.
What matters is identifying meaningful patterns.
A two-point Lighthouse fluctuation on one URL is probably noise. A 15-point decline across most URLs using the same template deserves attention. A small LCP increase in one run may mean nothing. A sustained increase across several scheduled runs is harder to dismiss.
Good monitoring provides enough historical evidence to distinguish those situations.
Why Agencies Need Historical Performance Evidence
The same principle is particularly useful for agencies.
Clients rarely report performance problems in technical language. They say the site feels slower, rankings dropped, conversions changed, or somebody ran PageSpeed Insights and saw a bad score.
Without historical data, the agency starts investigating from the present state of the website. That can become surprisingly difficult when multiple teams have deployed changes during the previous few weeks.
Historical performance data changes the conversation.
Instead of simply telling the client that product pages currently have a Performance Score around 70, the agency can establish that those pages were averaging around 88 until a particular date. After that point, most monitored product URLs dropped into the low 70s and remained there.
That evidence does not automatically prove which deployment caused the regression. It does, however, narrow the investigation considerably.
It also makes reporting more useful. Rather than sending clients another snapshot filled with Lighthouse numbers, agencies can show trends, identify when deterioration began, demonstrate whether fixes restored previous performance, and separate long-standing problems from newly introduced ones.
That is a much stronger use of performance data.
What Should Be Monitored Continuously?
The answer depends on the site, but monitoring should provide enough coverage to detect both page-level and template-level changes.
For most large websites, that means tracking a representative set of URLs across important templates rather than watching only the homepage. Product pages, category pages, landing pages, editorial pages, and other high-value templates should be represented.
Both mobile and desktop results can matter because the performance profile may differ significantly between them.
The metrics themselves should include more than a single score. Performance Score, LCP, CLS, INP where field data is available, TBT, FCP, and TTFB can provide different signals about what changed.
Failed checks matter too. A performance monitoring system that suddenly cannot successfully test a group of URLs may be telling you something important even before you look at the performance metrics.
Most importantly, keep the history.
Without previous measurements, every audit starts from zero.
From Automated Lighthouse Audits to Regression Monitoring
There is an important distinction between automating audits and actually monitoring regressions.
Running 500 Lighthouse tests automatically is useful. Running those same tests every week is better. But the real value appears when the results can be compared over time.
That comparison creates a baseline.
Once you have it, you can start asking much better questions. Which URLs changed since the previous run? Which metrics deteriorated? Did the problem affect mobile, desktop, or both? Is the change isolated to several URLs or visible across an entire template? When was the last healthy measurement?
These are operational questions rather than audit questions.
PSI Lynx is built around this workflow. Projects can contain large URL sets imported manually, through CSV, sitemap, or JSON feeds, and Lighthouse checks can run manually or on a schedule. Results are stored per URL so teams can see metric history and trends instead of treating every test as an isolated report.
The checks cover mobile and desktop performance and retain Lighthouse metrics including Performance, LCP, CLS, INP, FCP, TTFB, TBT, Speed Index, and TTI. The project view also keeps batch history, individual URL results, and historical metric data, making it possible to investigate changes across repeated runs.
That does not replace Lighthouse. It changes how Lighthouse data is used.
Instead of opening PageSpeed Insights because somebody suspects a problem, you already have measurements from before the problem appeared.
Performance Monitoring Is Really Change Monitoring
There is nothing wrong with a one-time Lighthouse audit. It is one of the fastest ways to understand how a page performs and identify potential optimization opportunities.
The mistake is expecting a snapshot to tell you what happened over time.
For websites that change frequently, the important performance question is rarely just “How fast is this page?” It is whether the page was faster before and, if so, when that changed.
Once you manage hundreds or thousands of URLs, the question becomes broader: what changed, when did it change, and how much of the website was affected?
That is the job of performance regression monitoring.
A Lighthouse audit gives you the current state. Continuous web performance monitoring gives you the timeline around that state. Put those together across enough representative URLs, and performance data stops being a collection of scores you check occasionally.
It becomes evidence you can use to understand what changed after a release, where the regression appeared, and where your team should start looking for the cause.