What a web performance test actually measures
A web performance test runs one scripted page load under conditions that never change: a fixed device profile, a throttled network, a cold cache, and nobody actually using the page. Google Lighthouse, the lab tab of PageSpeed Insights, and WebPageTest all follow that model. The whole point is reproducibility. Run the same test tomorrow and you get the same number, which is what makes it useful for catching regressions and chasing down bottlenecks. The cost of that reproducibility is that a lab test does not represent your real users.
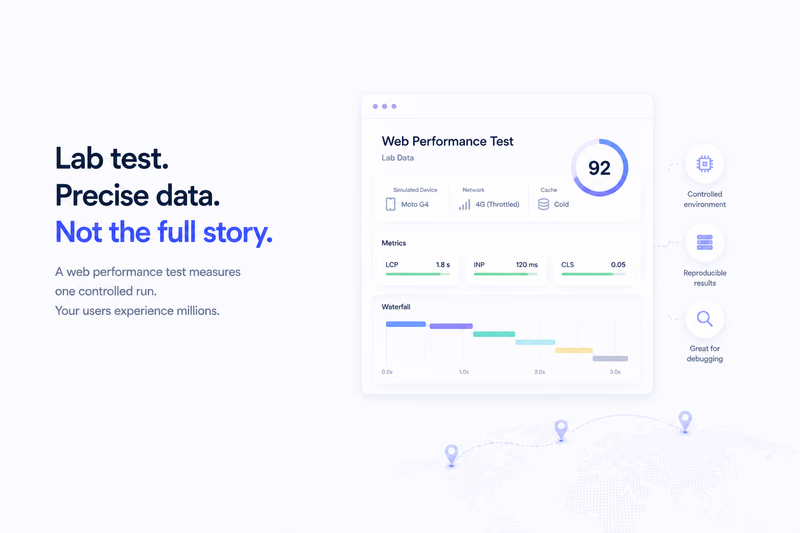
A web performance test, also called a synthetic test, measures one scripted page load under fixed, repeatable conditions: a set device profile, a throttled network, and a cold cache, with nobody actually using the page. Google Lighthouse, WebPageTest, and the lab tab of PageSpeed Insights all work this way. It is excellent for catching regressions and finding bottlenecks, and blind to how the page feels for your real, varied audience. Here is what it captures well and where it falls short.
The lab setup
Lighthouse defaults to an emulated Moto G4: a modest multi-core CPU profile throttled to roughly 4G LTE, with options like “Slow 4G” if you want it harsher. Your real audience spans iPhones, Pixels, laptops, and connections from fibre to 3G. The test also starts from a cold cache with no stored assets, over a clean data-center connection. Controlled, repeatable, and deliberately cut off from geography and cache state.
The browser then parses your JavaScript, paints the page, and pulls in images, fonts, and stylesheets, all at that one fixed cost. No second visit where a service worker serves cached CSS. No returning user who already has your fonts in memory. No one scrolling mid-load. Just a single load, start to finish, on a test device.
That rigidity is the feature, not a flaw. Because the conditions are pinned, you can run the test after each change and say with confidence whether you got faster or slower. It is also why Lighthouse gates work: you push a change, CI runs Lighthouse, and it passes or fails on a deterministic score.
What the lab measures well
Lab data is strong at CPU-bound problems. If your main thread is blocked by a two-second parse task, Lighthouse sees it. If a huge stylesheet delays First Contentful Paint, the test measures the delay. If late-loading banner images shove the layout around, the cold-cache run reproduces the shift. You get a full timeline in DevTools and can point at the exact script or recalculation that hurt.
Largest Contentful Paint and Cumulative Layout Shift both reproduce reasonably well in the lab, because they are tied to page structure and asset delivery rather than to who is visiting. Lighthouse hands you a score, an Opportunities list (for example, unused CSS), and a Diagnostics tab with the raw metrics. You read the timeline, find the image or font that cost you, and fix it.
Where the lab is blind
Interaction to Next Paint is the big gap. INP measures the lag between a user’s interaction and the browser’s visual response, and a lab run has no human doing the interacting. Lighthouse can script a sample interaction, but that is not the same as a distribution of real clicks across the 50th, 75th, and 99th percentiles. The lab can tell you Time to Interactive looks fine and still miss that opening a dropdown lags by 300ms for real users.
It also ignores what happens after load. If your page settles in two seconds and then an analytics library jams the main thread every few seconds for the next half minute, the test is already done and never sees it. Real users stay on the page.
Cache state is another blind spot. A returning visitor on a warm cache experiences a fundamentally faster page than the cold-cache scenario Lighthouse always runs, so the lab biases toward the worst-case first visit. And it is one run, not a distribution: one device, one network, one moment. It cannot tell you whether your slow experience hits 5% of users or half of them, or how the page feels on a spotty mobile network in Southeast Asia.
A workflow for lab data
Start in DevTools. Run Lighthouse on the page, then read the Opportunities and Diagnostics rather than fixating on the headline number. Find the slowest scripts, the largest images, the render-blocking CSS, and take the obvious wins first.
Then reach for WebPageTest when you want detail. Pick a harsh profile, a slow connection and an older device, and read the waterfall. Is the time going to Time to First Byte, to JavaScript parsing, to image decoding? That is where the lab earns its keep.
Use the score to gate deploys. Pick a threshold, somewhere around 80 is common, and fail the CI job when a change drops below it. That catches regressions before they reach anyone. Just remember the score is a weighted blend that Google retunes over time, so treat it as a summary, not the truth. A high Lighthouse score does not mean your real users are happy.
The score is a diagnostic, not a ranking
This is the part people miss. Google ranks on real user Core Web Vitals (field data), not on your Lighthouse score (lab data). A 95 in the lab next to a 75th-percentile LCP of 3.2 seconds in the field just means your lab profile is not representative of your audience. Do not optimize for the score. Optimize for the metrics both the lab and your RUM report, LCP, INP, and CLS: debug in the lab, then confirm with real data.
Related
Web Performance Test vs Real User Performance: What’s the Difference?