Web Performance Test vs Real User Performance: What's the Difference?
Your page loads in 1.8 seconds in Lighthouse. A user on a 4G connection in Mumbai says it feels slow. Both can be true at once. That gap, between a web performance test (lab data) and real user performance (field data), is the thing you have to understand before you can make a site genuinely fast for the people who actually visit it.
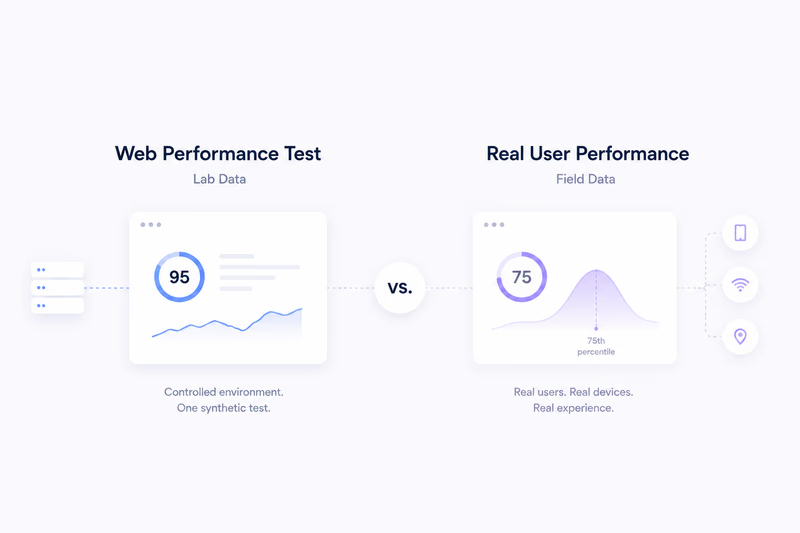
A web performance test runs one controlled measurement of your page: a fixed device profile, a throttled network, an empty cache, usually from a data center. Google Lighthouse, WebPageTest, and the lab section of PageSpeed Insights all work this way. The result is reproducible and isolated, which makes it good for debugging and for gating deploys on a clear pass/fail line. What it does not tell you is how the page behaves for the thousands of people hitting it from different devices, networks, locations, and cache states.
Real user performance (field data, or RUM) is the other side of that coin. It is measured inside real browsers as actual visitors use the site, then aggregated. The Chrome User Experience Report (CrUX), the field section of PageSpeed Insights, and your own monitoring all capture it. Instead of one run you get a distribution of real outcomes, read at the 75th percentile over a rolling 28-day window. That distribution is what your users actually live with.
The one-paragraph version
A lab test answers “how fast can this page be under ideal, controlled conditions?” Field data answers “how fast is it for most of my users, most of the time?” Same website, two completely different angles. Lab is reproducible and diagnostic. Field is messy and representative.
Why the score and the complaints disagree
You have probably seen a site score 95 in Lighthouse while users complain about lag, or score 65 while feeling perfectly responsive. The reason is the setup.
A Lighthouse run uses a fixed mid-range Android profile, a throttled 4G network, and a cold cache. Every run starts from the same spot. Real traffic does not. Some visitors are on flagship phones and fibre, others on budget hardware and patchy 3G. Some arrive with a warm cache from a previous visit, some on a cold first load. And real people actually click things, which generates interaction latency that no scripted run produces. So a 95 in the lab can describe a best case your 75th-percentile user rarely sees, and decent field numbers can still hide a slow tail at the 95th percentile.
Where to go next
If you score well in the lab but your field metrics are poor, the gap lives in real-world variance a single synthetic run cannot see. If the two line up, you are in good shape; keep pushing the 75th percentile down.
The rest of this series digs into each side. One part covers how to read and act on lab data, one covers how to measure and interpret field data, and one walks through exactly why a Lighthouse score and a Core Web Vitals assessment drift apart. The point was never a perfect Lighthouse number. The point is a site that is fast for real people, and that takes both: the lab to debug, the field for the truth.