
Core Web Vitals Monitoring: The Complete Guide
Core Web Vitals monitoring means tracking LCP, INP, and CLS on real users over time, not just running a Lighthouse audit once. This guide covers the metrics, lab vs field data, why one-time audits miss regressions, and how to monitor performance at scale.
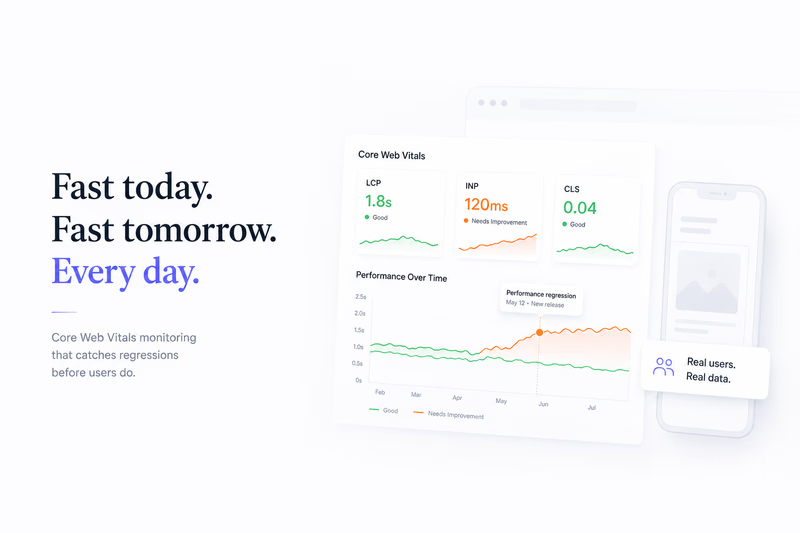
Core Web Vitals monitoring is the practice of tracking LCP, INP, and CLS on real users continuously, so you catch performance regressions when they happen instead of weeks later. A single Lighthouse audit tells you how one page performed in a lab at one moment. Monitoring tells you how every page behaves for real visitors over time, and whether your last deploy quietly made things worse. This guide walks through the metrics, the difference between lab and field data, why one-time audits fall short, and how teams monitor Core Web Vitals across hundreds or thousands of URLs.
What are Core Web Vitals?
Core Web Vitals are the three metrics Google uses to measure real-world user experience, assessed at the 75th percentile of your visitors:
- Largest Contentful Paint (LCP) measures loading: how fast the main content becomes visible. Good is under 2.5 seconds.
- Interaction to Next Paint (INP) measures responsiveness: the lag between a user’s interaction and the browser’s response. Good is under 200ms.
- Cumulative Layout Shift (CLS) measures visual stability: how much the layout moves unexpectedly while loading. Good is under 0.1.
Google grades these on real Chrome users over a rolling 28-day window, not on a lab test. If you want the full breakdown of how INP replaced First Input Delay and what each metric demands in 2026, see Core Web Vitals 2.0: master INP and LCP. To measure them on your own visitors, read how to measure Web Vitals on real users.
Lab data vs field data: why your Lighthouse score can mislead
There are two ways to measure performance, and they answer different questions.
Lab data comes from a controlled test: a fixed device, a throttled network, an empty cache, run once. Google Lighthouse, WebPageTest, and the lab tab of PageSpeed Insights all work this way. It is reproducible and great for debugging, which is what a web performance test actually measures.
Field data (also called RUM, or the Chrome UX Report) comes from real visitors on their own devices and networks, aggregated over time. This is what Google actually ranks on.
The two often disagree. A page can score 95 in Lighthouse while real users struggle, because the lab profile isn’t representative of your audience. That gap is exactly why good Lighthouse scores still fail rankings, and it’s the whole reason a web performance test differs from real user performance. The rule of thumb: debug in the lab, but judge success by the field.
Why isn’t a one-time audit enough?
A one-time audit is a photograph. It captures a single moment, and modern websites don’t hold still. Every deploy, plugin, tracking script, and third-party integration changes how pages behave. By the time the next monthly audit runs, the site can behave completely differently.
This is why web performance monitoring beats one-time audits: monitoring tracks the trend and flags regressions as they happen. It’s also why monthly SEO audits no longer work at scale, and what those monthly audits miss between releases. A report can look healthy while rankings slip, because static reports can’t keep up with continuous monitoring and automated SEO reports miss the regressions building up in between.
How does performance decay without anyone noticing?
Most sites don’t break in one bad release. They get slower gradually, through dozens of small changes that each look harmless. A tracking pixel here, a heavier component there, another personalization widget before a campaign. None of it trips an alarm, but together it adds up.
That slow accumulation is why websites get slower without anyone noticing, and it’s why Core Web Vitals problems usually start long before rankings drop. Left unwatched, it’s also how Core Web Vitals problems slowly damage SEO performance. It explains a frustrating pattern too: a site can pass QA but still fail Core Web Vitals a week after release, and it can feel fast to you and still fail SEO for users on slower devices.
How do you monitor Core Web Vitals at scale?
Checking a homepage tells you almost nothing about a large site. An ecommerce platform generates thousands of unique page states through filters, pagination, localization, and product variations, and each can behave differently. A homepage may score 95 while product templates sit far lower.
That’s why checking SEO on just a few pages is no longer enough, and why SEO teams monitor Core Web Vitals at scale with automation instead of manual spot checks. The compounding is real: our teardown of Nike’s PageSpeed Insights results found a 60/100 health score and a mobile LCP of 19.18 seconds, on one of the most sophisticated ecommerce sites in the world.
A practical monitoring setup looks like this:
- Track every important URL, not a sample, on both mobile and desktop.
- Run on a schedule and after each deploy, so regressions surface immediately.
- Read the 75th percentile of each metric, per page type, and watch the slow tail.
- Alert when a metric crosses a threshold, rather than waiting for the next report.
How do you turn monitoring data into action?
Data only helps if it points to a fix. The goal isn’t a perfect score; it’s finding the specific issue behind a regression and shipping the fix. That’s the difference between a raw report and an action plan, which is how to turn a Google Lighthouse report into an action plan: read the Opportunities and Diagnostics, prioritize by user impact, assign an owner, and confirm the fix in the field.
Historical context is what makes this fast. When you can see exactly when a metric started sliding and which release introduced it, you stop guessing and start following a timeline.
How do Core Web Vitals fit into AI search and rankings?
Performance is no longer just a UX concern. Higher rankings don’t always mean more traffic, and when rankings are up but traffic is down, a slow mobile experience is often part of the story. AI search raises the stakes further: AI crawlers work on tight timeouts, so page speed affects AI crawler rankings and GEO visibility. And as AI visibility reports arrive, knowing what changed on your own site becomes just as important as knowing where your brand appears.
Where psiLynx fits
psiLynx is built for exactly this: bulk Lighthouse audits and Core Web Vitals monitoring across hundreds or thousands of URLs, with history per page, regression alerts after deploys, and real Chrome user (CrUX) data alongside lab scores. You can explore the features or start free with no credit card.
Getting started
If you take one thing from this guide: stop treating performance as a one-time project. Measure the right metrics (LCP, INP, CLS) where they count (the field), monitor every page continuously, and act on regressions before they reach users or rankings. That is Core Web Vitals monitoring, and on a modern site it is the difference between catching a problem in a day and explaining a traffic drop months later.